

Someone on your team asks how much user 4471 is costing you.
You can get a number. Sum every call tagged with that user_id over the month and you get, say, $212. That's correct and it doesn't help, because the next question is "is that bad?", and $212 can't answer it.
$212 from a paying enterprise seat running a 40-turn research session is fine. $212 from a free-tier account that made 9,000 calls to the same prompt at 3 a.m. is a problem you should have caught on Tuesday. Same total, opposite conclusions.
So the question is really seven questions. Here's each one and the screen that answers it. Figures are illustrative; the shape is what we keep seeing, not one customer's invoice.
1. Compared to everyone else
Start with a ranking. The Users page lists every user_id your app sent in the selected range (last hour, day, week, month, or a custom one) with requests, tokens, cost and plan, sorted by cost. It also shows whether a firewall rule currently has them blocked.
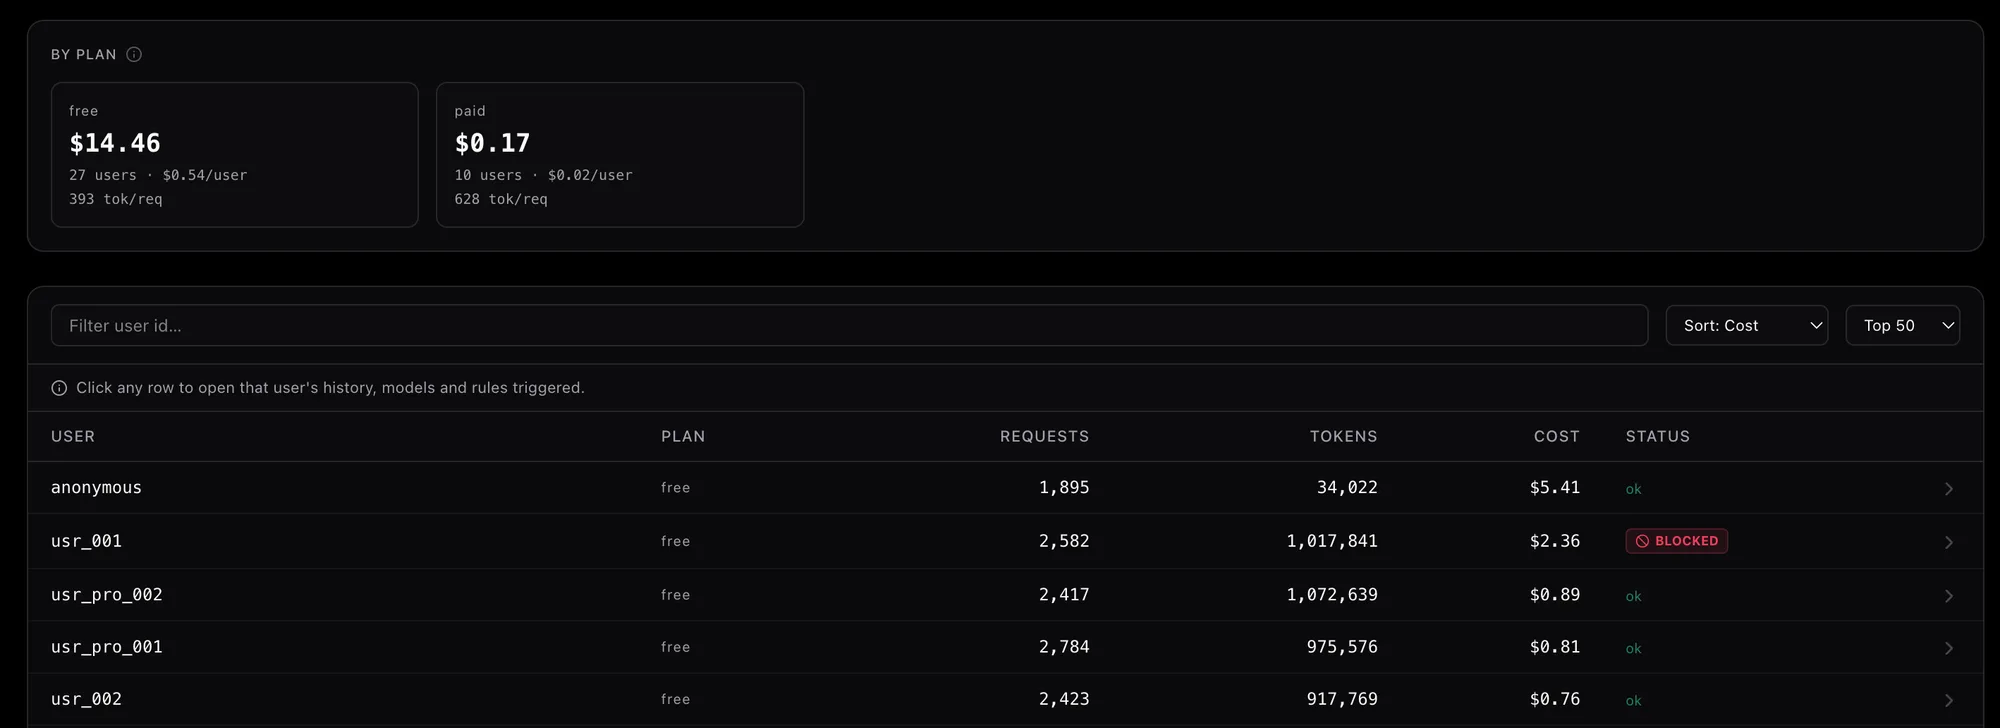
Cost per plan up top, then every user ranked by what they cost. One of them is blocked.
This turns "we spent $900 on LLM calls" into "these eleven accounts spent $900". If one user is 30% of the total, you've found the account that needs a cap. If the top twenty sit within a few dollars of each other, your cost is diffuse and a per-user cap won't move it.
The page also tells you whether you're identifying users at all. In the screenshot the top spender is anonymous, which is what calls with no user_id get. If every row reads that way, your app isn't passing the tag. See the identity tags; nothing below works until it does.
2. Compared to the tier they're on
Above the ranking, the By plan strip shows, per paid_plan value, total spend, active users, average cost per user, and tokens per request. The ranking can't tell you whether a tier is paying for itself. This does.
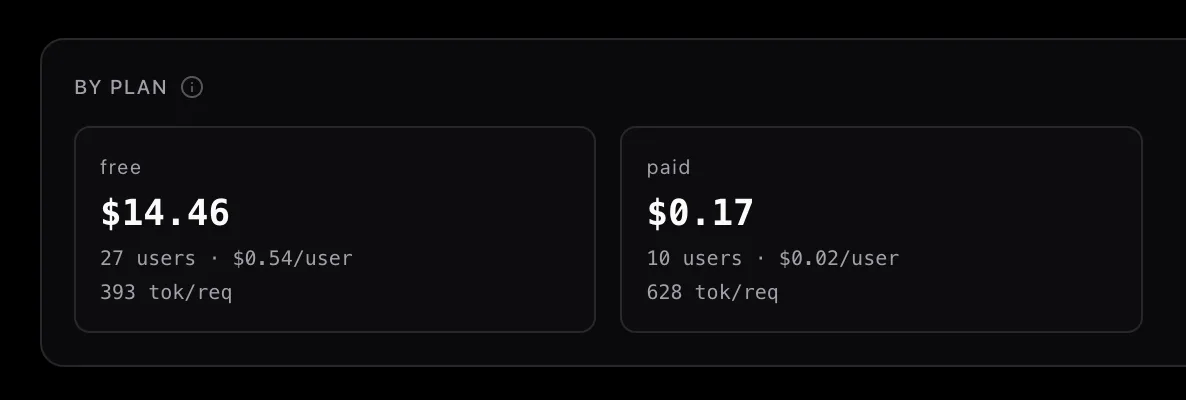
Two tiers side by side. The free one costs 27 times more per head.
In this project a free user averages $0.54 and a paid user $0.02. The free tier costs 27× as much per person as the customers who pay. Whether that's acceptable is a business call, but you can only make it with both numbers in view. The per-request token counts underneath say the paid users send larger requests, so the gap is in what free users call, not how much they send per call.
One detail. Plan names show exactly as your app sent them. If the strip lists both free and Free, that's not a display bug. Rules match plan values byte for byte, so those are two plans with two separate budgets, and the fix is in your app.
3. Per request
Two users at $60 each can be nothing alike. One made 3,000 small calls; the other made 40 enormous ones. Divide cost by requests (both are columns on the Users page) and they split apart.
Many cheap calls points at a loop, a retry storm, or a script hammering an endpoint. A few expensive calls points at context bloat: conversation history that never gets trimmed, a retrieval step stuffing every document into the prompt, a system prompt that grew to 6,000 tokens while nobody was watching. The first is fixed with a per-run cap or loop detection. The second is fixed in your prompt assembly. Total spend won't tell you which one you have.
4. Over time
Click a user and their page opens with a Spend trend chart: spend per day across the range.
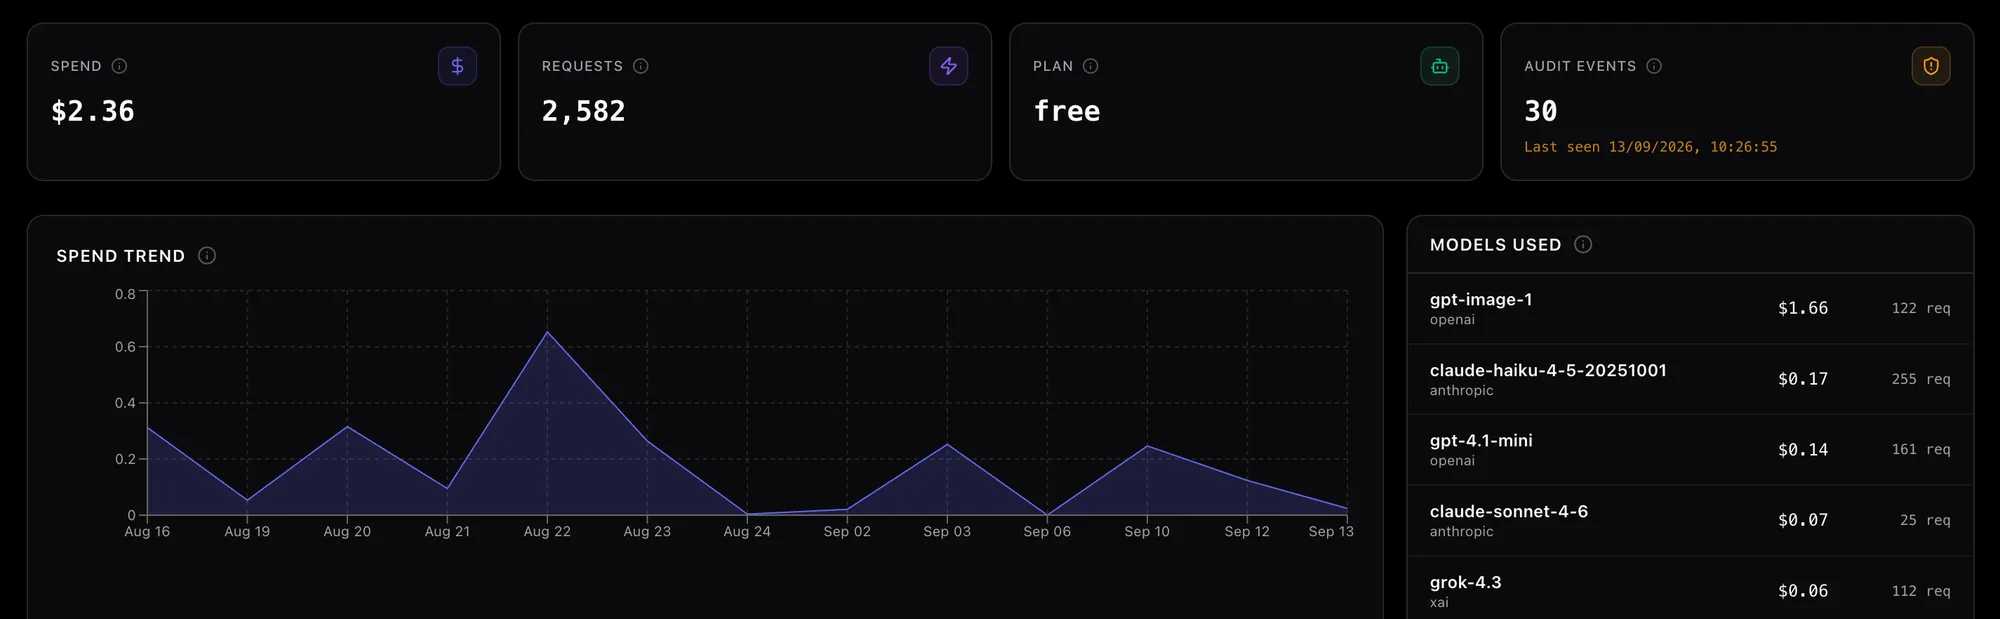
The tiles, the spend trend, and the models the spend went to. Note the spike.
A flat $2/day and a line that sat at $0 for three weeks then hit $58 on Thursday are both "$60 this month". Flat is somebody using the product. The spike is an incident: a runaway agent, a new feature misbehaving for this one account, or a credential that leaked to someone with a for-loop. The chart says which, and roughly when to start reading logs.
5. By model
The Models used panel on the same page lists where this user's spend went, per provider and model, most expensive first.
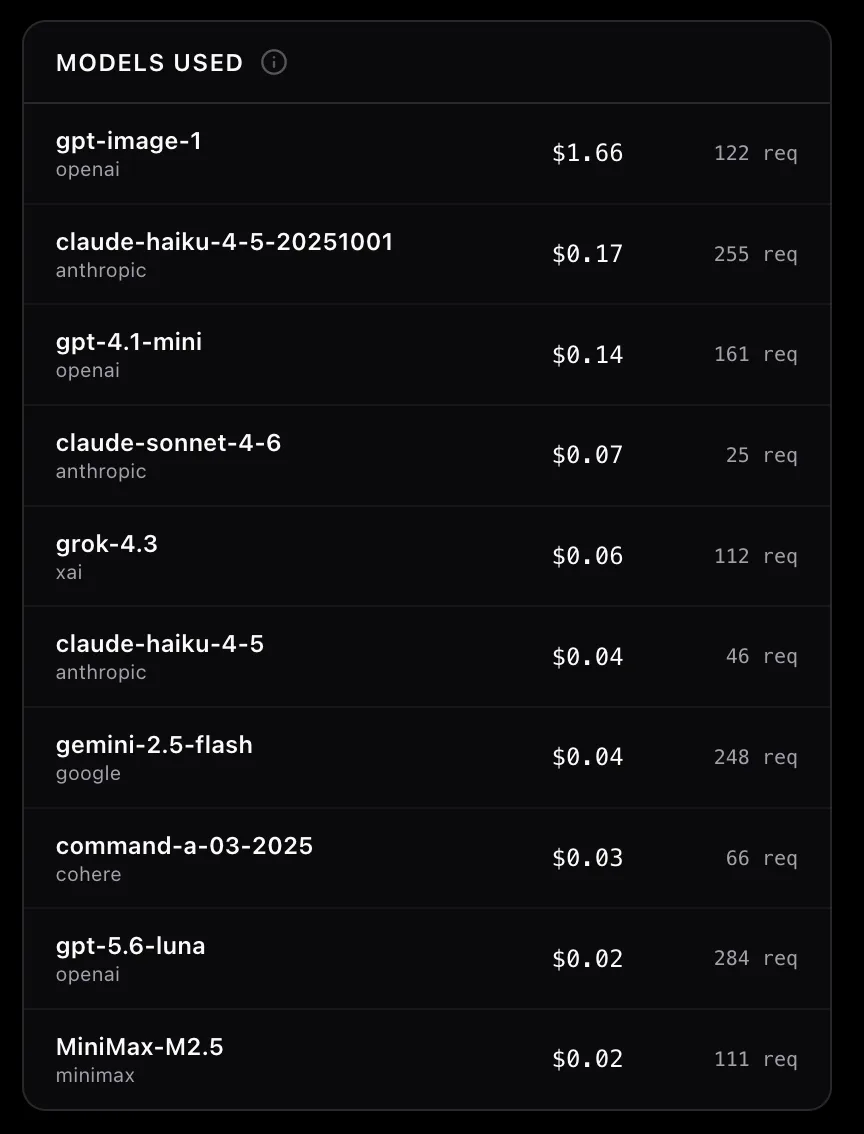
Ten models, one bill. gpt-image-1 is 122 of this user's 2,582 requests and 70% of their cost.
This user is a clean example. Ten models, and one of them, an image model called 122 times out of 2,582, accounts for 70% of the spend. The other 2,460 requests, spread over text models from six providers, come to $0.70 combined. Whatever this user does that produces images is the whole bill.
The same panel catches a mistake we see a lot: a code path that was meant to use the small model and doesn't. If a support-chat user shows 90% of their cost on your frontier model when that chat is supposed to route to the mini one, routing is broken for something this user does, maybe a language, a tool call, a plan flag. You just found a bug through billing data.
6. Per conversation
The Recent sessions panel groups this user's calls by session_id, with turns, model calls and cost per conversation. Open a session and you get every turn with its cost, plus a gauge titled Cost vs typical session.
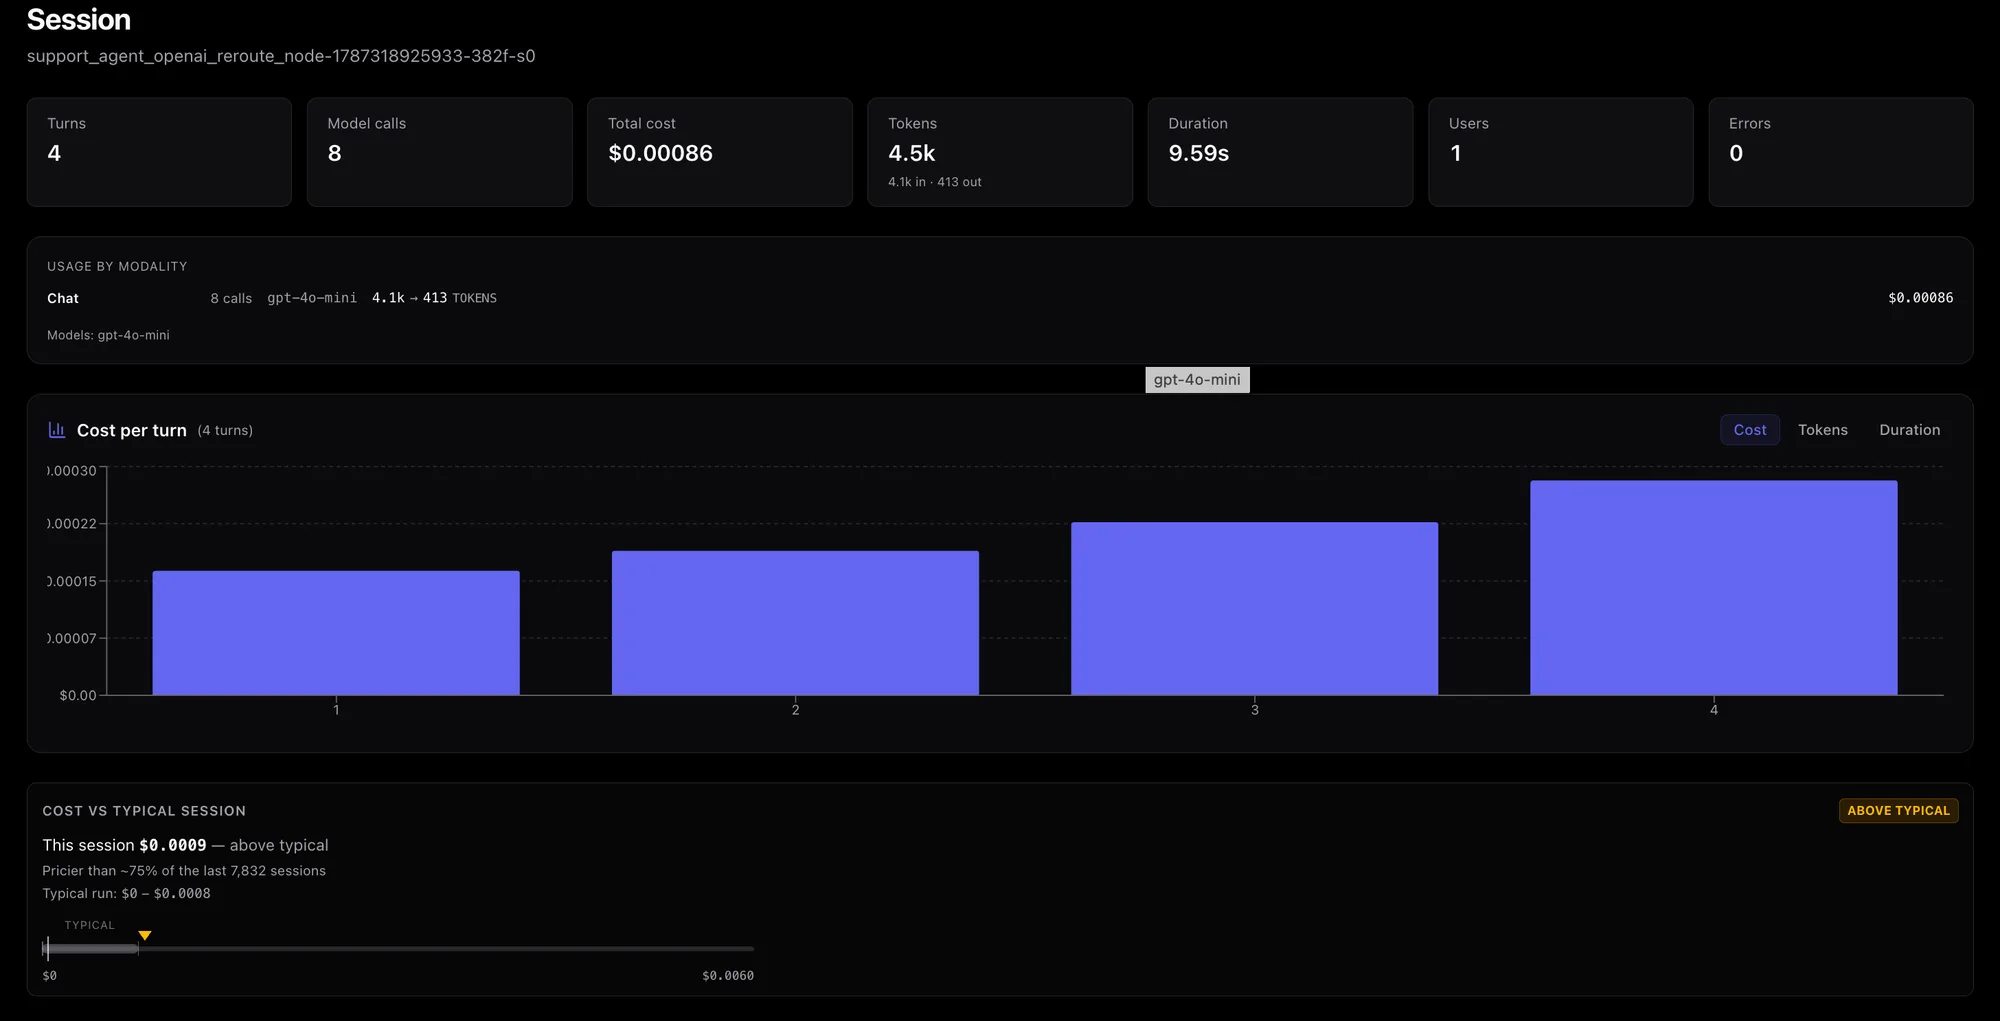
A four-turn session placed against 7,832 others. Above typical, and by how much.
"This session cost $4" is another number with no answer attached. The dashboard builds a baseline from every session in the project over the last 30 days (the mean, the spread, and the 5th through 95th percentiles) and places this one on it. The session above is a fraction of a cent in absolute terms and still lands above three quarters of the project. A $4 session where the typical one is $3.50 is Tuesday. A $4 session where 95% come in under $0.40 is the one to open.
This cut also shows how a user got expensive. $60 across 200 short conversations is ordinary use. $60 across two conversations of 80 turns each deserves a look, legitimate or not.
7. Per call, and what was done about it
The last two panels get specific. Recent model calls lists individual calls with time, model, input and output tokens and cost, and each one opens its full trace, span by span. If you want to read the actual 40,000-token prompt that cost $0.60, it's there.
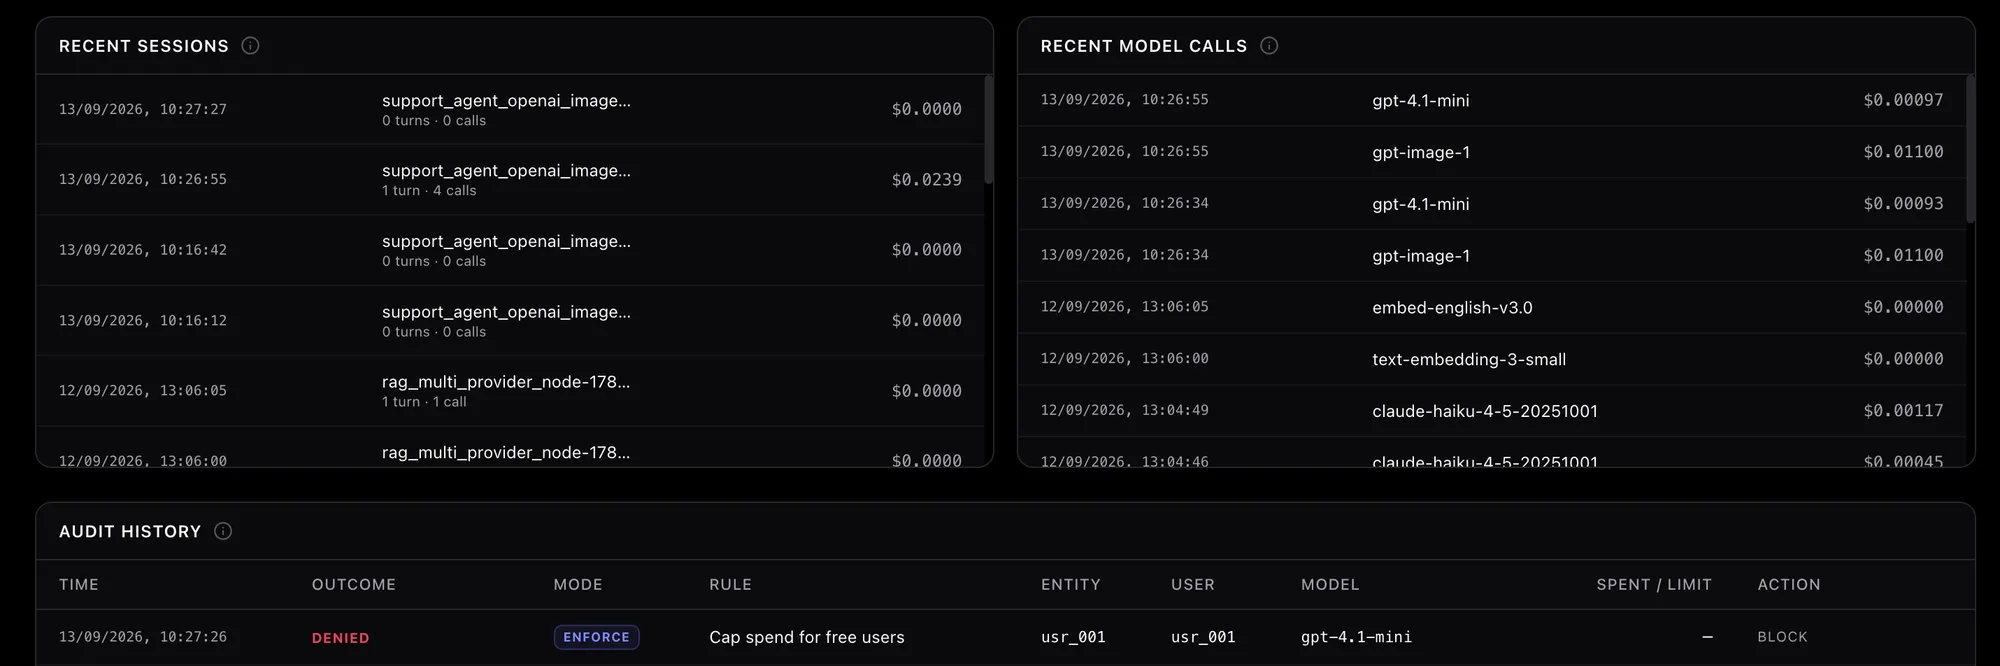
Sessions, individual calls, and the audit row behind the Blocked badge from the first screenshot.
Audit history lists every firewall decision involving this user: the rule, the mode, the model the call targeted, and the outcome. The row above picks up the story from the Users page. usr_001 showed as Blocked because the rule Cap spend for free users denied a gpt-4.1-mini call in Enforce mode. Enforce rows blocked or rerouted a call. Dry-run rows changed nothing and only recorded what the rule would have done. So the page tells you what you already tried, and whether the rule you wrote last month would have caught this had it been enforcing.
The answer is usually a rule
Once you know which cut explains the spend, the response is one rule. An account at the top of the ranking gets a Cap spend per user rule. A free tier that costs nearly as much as pro gets the Stop free-tier abuse template; here's the recipe. A user whose sessions run 80 turns gets a per-session limit. New block rules start in dry-run, so you can write one, watch the audit history fill up with what it would have done, and switch it to enforce when the numbers look right. The enforcement side is written up in how to set per-user LLM budgets in a multi-tenant SaaS.
None of this works without three tags on your calls: user_id, paid_plan, and a session_id that holds steady across the turns of one conversation. The full walkthrough of the page is in the Users docs.