

Open the dashboard and you land on Overview. Its subtitle asks three questions: is your LLM spend safe, are your agents looping, is TokenPolice paying for itself. The page answers them top to bottom, for whatever range you pick top right: 1h, 24h, 7d, 30d or custom.
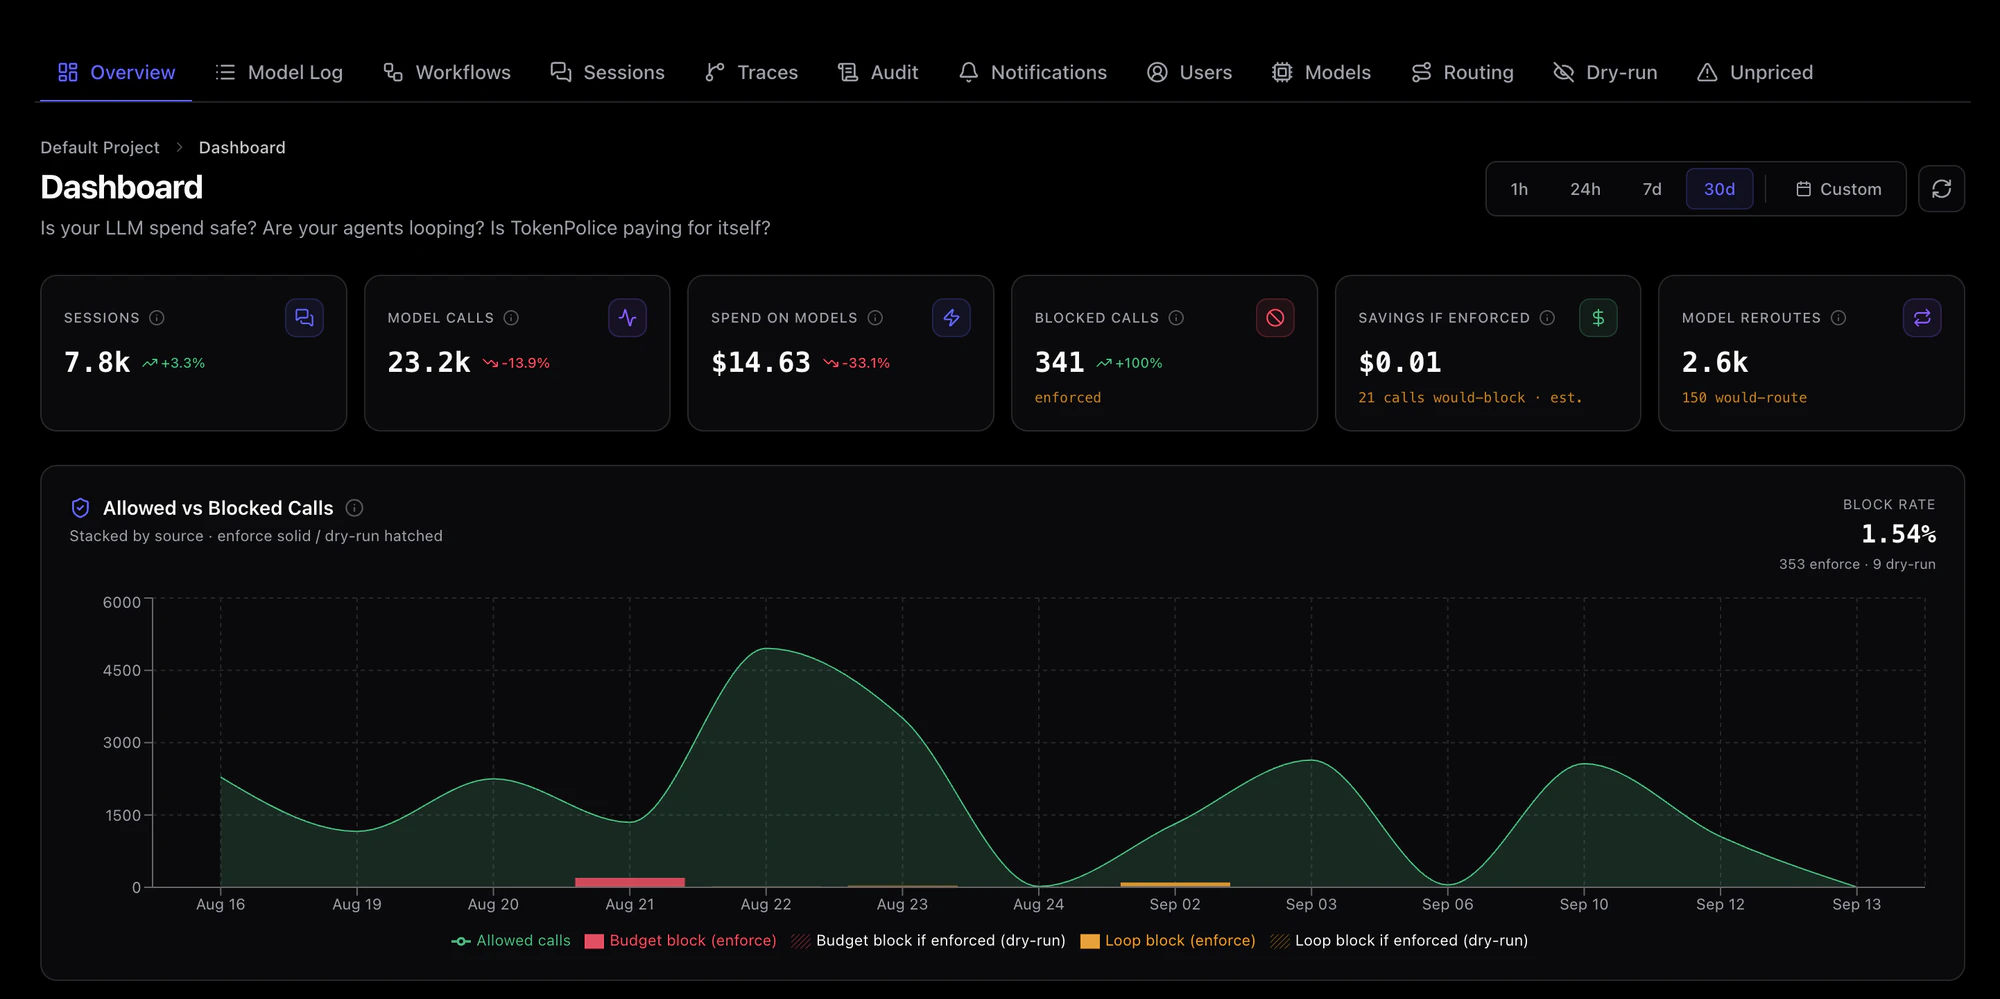
Six numbers

Sessions, model calls and spend, each against the previous period. Then the three TokenPolice numbers: calls actually blocked, an estimate of what your dry-run rules would have saved had they been enforcing, and calls your reroute rules swapped to the model they name. Here spend fell 33% while blocks doubled.
Allowed vs Blocked
Every call in the range, stacked: allowed, budget blocks, loop blocks. Solid is enforced, hatched is dry-run. The block rate sits on the right.
Spend trend and unit economics
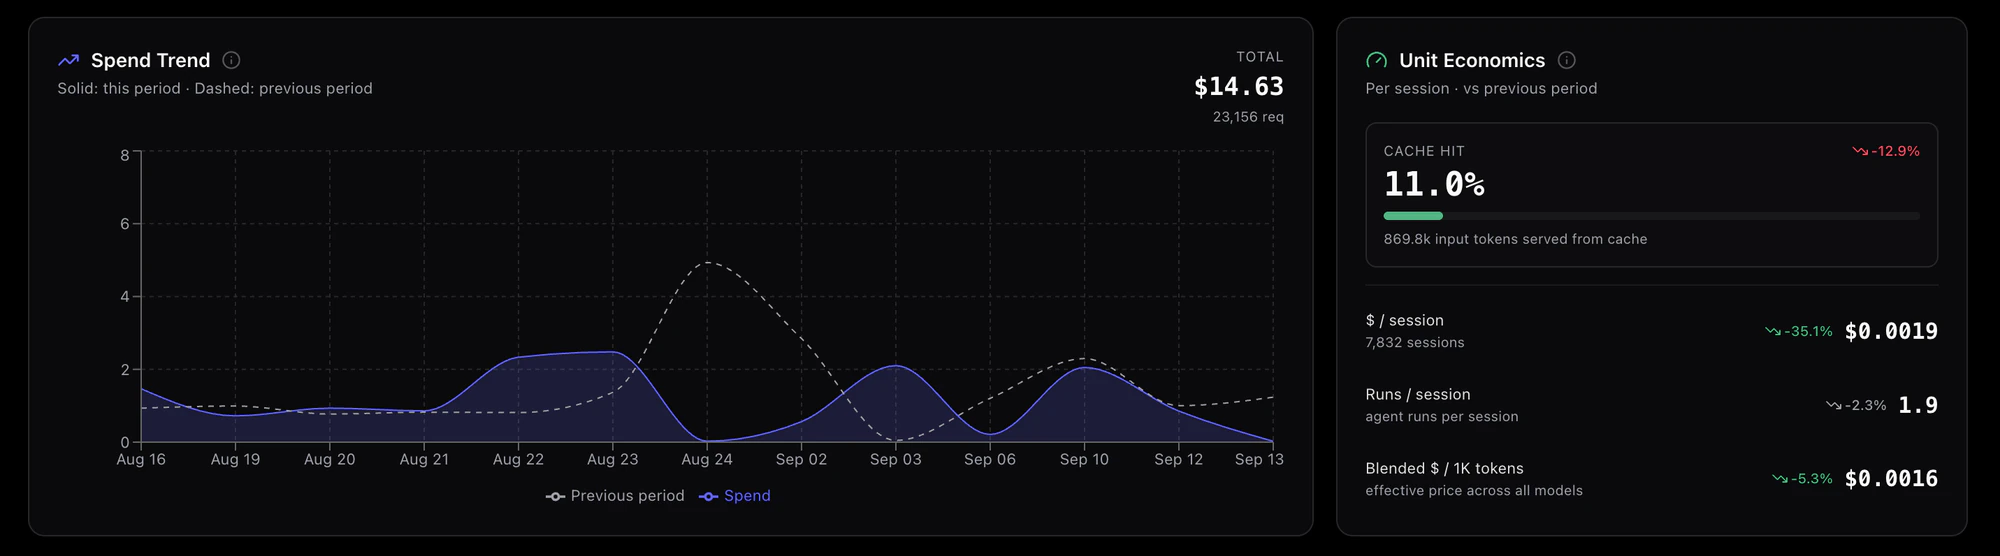
This period solid, last period dashed. Beside it: cache hit rate, dollars per session, runs per session and a blended price per thousand tokens. If sessions are flat and spend is not, this is where you notice.
Loops
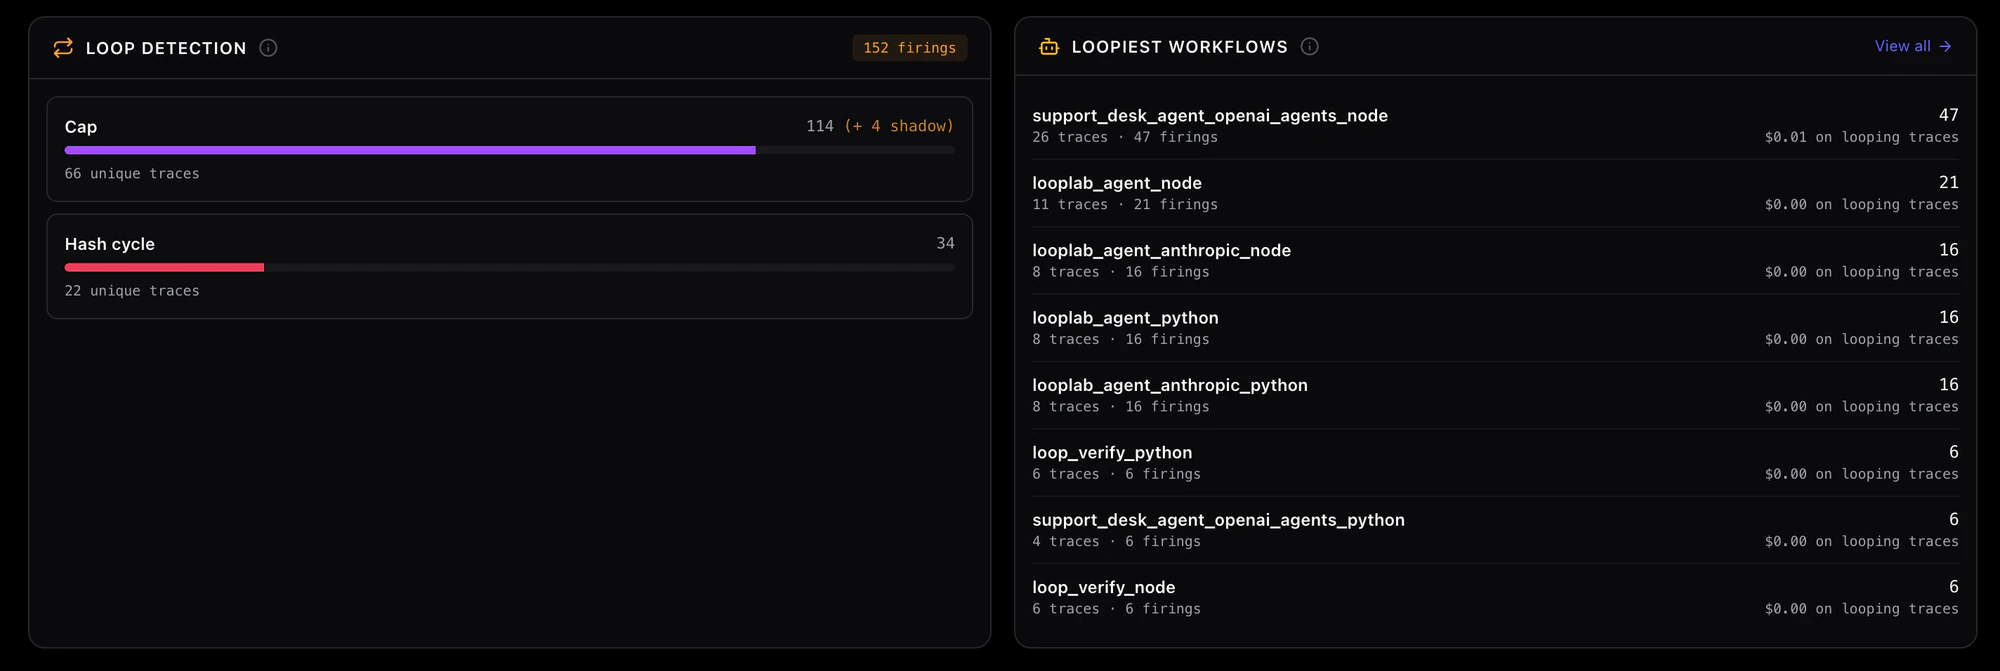
Firings split by the two detectors, exact prompt repeat and per-run cap, next to the workflows that looped most and what those runs cost. 152 firings in a month is normal for a fleet of test agents. In production, read it closely.
Users, Model Log and Audit hold the calls behind each number, and the Overview docs explain every tile. Before your app's first call the tiles read a dash. Wiring it in takes a few minutes.